Correlation

Note Description
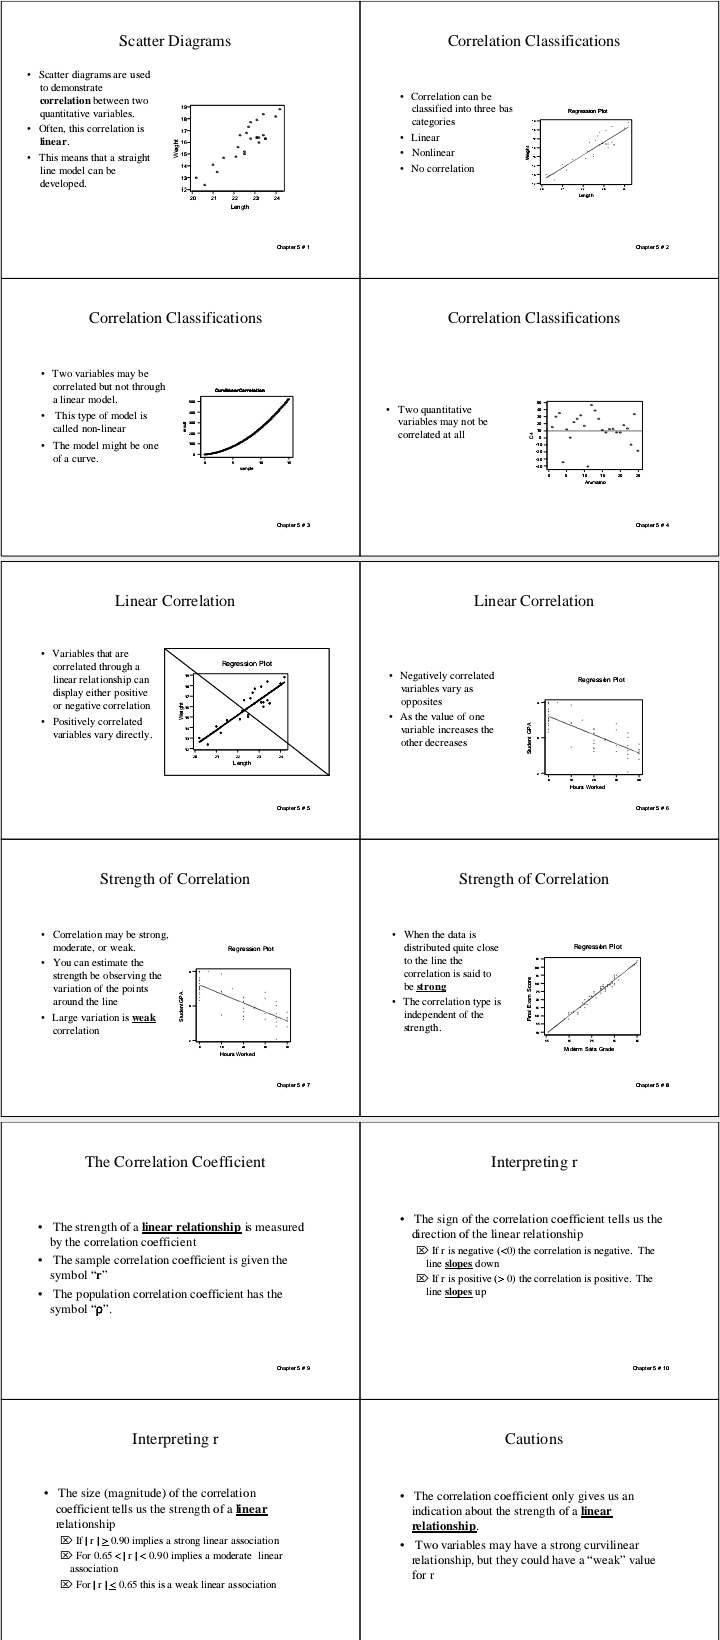
Scatter diagrams are used to demonstrate correlation between two quantitative variables. • Often, this correlation is linear. • This means that a straight line model can be developed.
...
Notes information
| Seller Price | GHC 0 |
| Added | 26 Mar, 2023 |
| University | University of Cape Cost |
| Course | Mathematics |
Note Review
No comments....
Submit your review

Martey Israel Tetteh
Recent Note Update: 26 Mar, 2023
University : University of Cape Cost